
From paper to vector: converting maps into GIS shapefiles
GIS is incredibly powerful: you can transform, overlay, and analyze data with a few clicks. But sometimes the challenge is getting your data into a form to be able to use with GIS. Have you ever been stuck on a geospatial analysis because you could only find a PDF or even paper map of what you needed? Or googled your topic followed by “shapefile” to no avail? The process of transforming a PDF, paper, or even hand-drawn map with boundaries into a shapefile for analysis is straightforward but involves several steps.
There are a number of reasons for wanting a boundary shapefile in GIS. One example is sampling: you may need political or planning boundaries to sample respondents for a survey. Another may involve understanding shifting boundaries over time. In my work, I have used digitization and georeferencing for converting hand-drawn maps of neighborhood boundaries, locating voting precincts for research related to gerrymandering, and understanding changes in neighborhood planning boundaries related to zoning and land use as part of my dissertation.
In this post, I’m going to walk us through the stages of turning an image into a vector shapefile, ready to be used for other spatial analysis. A shapefile is a file format for storing geographic information and related attributes, which allows us to visualize and analyze geographic information in GIS. This process, and the ease and certainty with which you transform your map, is dependent on your particular map and its features.
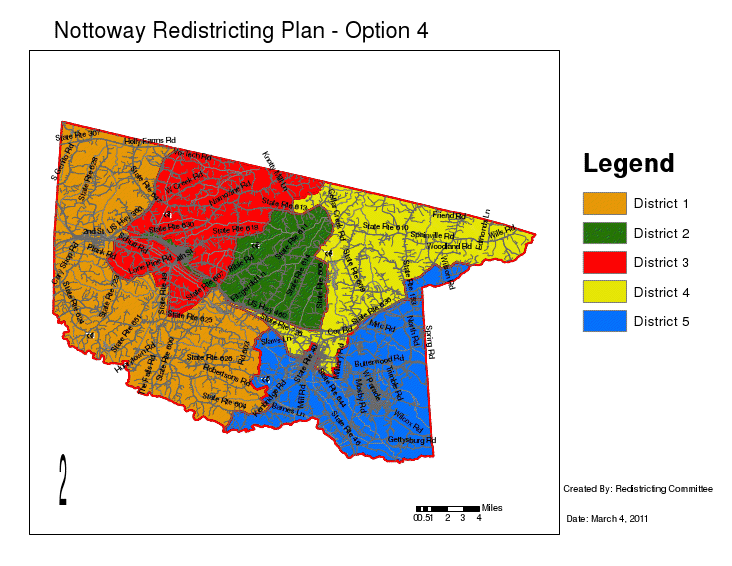
The example we will use is a voting precinct map: a map showing the geographic boundaries of voting districts. These precincts are the smallest scale at which votes are aggregated for an election, with associated polling places. The map we are using is for Nottoway County, Virginia, shown below. We want to create boundary shapefiles for each of the five colored districts to use for analysis.
Digitization
The first step is digitization, or preparing our map for the transfer into a GIS program. At this point, we start out with a paper map or a digital image of our map. We’ll want to scan the map if it’s on paper. If it’s already digitized, the next step is to open it up in a program such as Adobe Illustrator/InDesign/Photoshop which can read files, separate out layers, and export as TIFF or CAD.
We next want to try to isolate the map features, or layers, we are interested in extracting to bring into GIS. For our voting precincts map, we would ideally want to focus on the boundary lines between the colored areas and isolate them to import into GIS. This isn’t possible for every map, and indeed, it turns out that our Nottoway County map does not have separable layers. If we can separate out the layers, I find it most helpful to isolate the boundaries layer we’re trying to map (hopefully a line!), along with some key landmarks. These may be schools, rivers, roads, or the like – anything helps, but the purpose of separating layers is so we can leave behind any opaque layers that may make it harder to map the shape. While our Nottoway County map does not have separable layers, below is an example of a map for a different county, Caroline County, where I was able to isolate boundary layers from the background.

We then will export the file as a .TIFF or .CAD to import into GIS. At this stage the file is still an image, without geographic information.
Georeferencing
The next step is georeferencing: we need to add information about where this map and its features are located on Earth. After digitizing, we have a version of our map in a computer-accessible form, but it needs geographic information for it to be used for any spatial analysis.
Within the GIS program we’re using (I’ve done this in QGIS and ArcGIS, and there are video tutorials available online for each), we’ll want to add the file into our map.

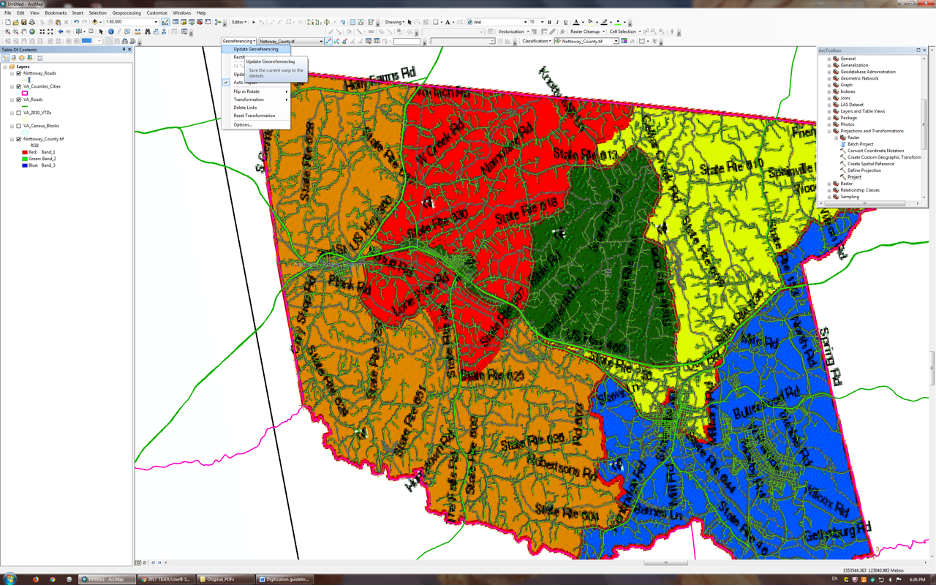
Our task now is to try to line up our map with features from other reference layer shapefiles. The goal is to find and add any reference layers that match features in the map image, whether those are political boundaries, streets, or natural features like rivers. We can see from this map that the border of the map is the county boundary, and the gray lines show roads (some of them labeled). I therefore found a shapefile of county boundaries (pink lines) and roads (light green lines) and added them to the map. UC Berkeley has a list of resources for GIS layers if you are looking for reference layer shapefiles. OpenStreetMap may also be helpful for figuring out where our map is located, but having shapefiles for boundaries that match any of the boundaries we are trying to map (like these county boundaries pictured above) can be very helpful in the next stage, as we can use them to trace wobbly lines.
Importantly, try to match the map projection and scale of the map image to those of any reference layers. Projections (the way we try to fit a 2D map to the curvature of the earth) vary, and our map may not match a specific projection, but it’s worth trying a few out, such as the appropriate State Plane if we’re mapping something at a small scale in the U.S. This process of adding our map may involve zooming in and out before re-adding our map image to match its scale to the base layers.
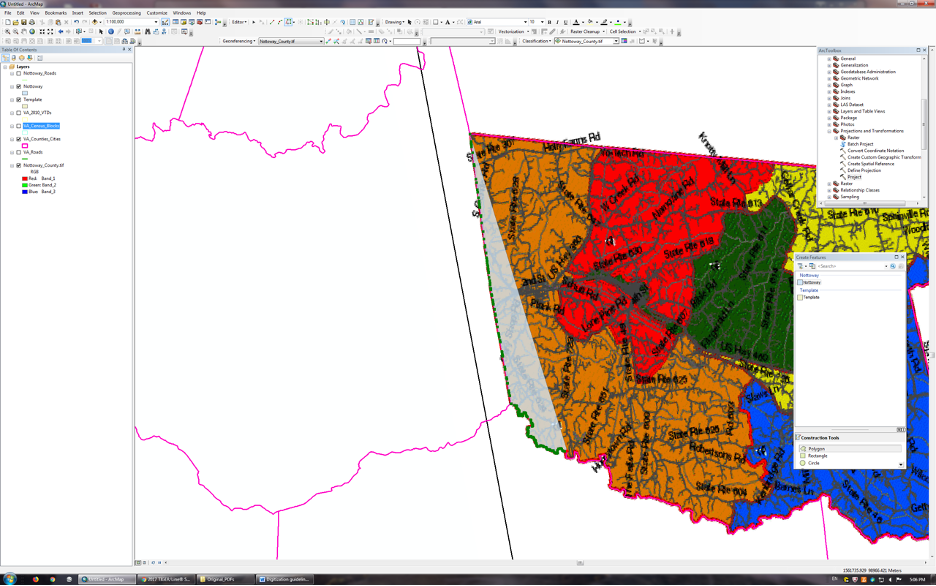
Once we’ve added in our image and fit it to our display, we will want to add reference points to our map within our GIS software to georeference it. In our example, we can use reference points such as the corners of the pink lines in our base layer representing county boundaries to fit our voting precinct map into the base layer’s outline for Nottoway County (you can see how in the left-hand image below, the corners of the county are not yet matched up).

When we’re content, we’ll want to save the georeferencing. It might not match as cleanly as the one pictured above, particularly if it’s hand-drawn. That’s ok – we’ll just have to use as many context clues as possible in the next step. We’ve now georeferenced our map! The map is still an image file, but it now has geographic information saved in it so someone using it will know where it is located on the earth.
Drawing
Finally, we’ll need to create our new vector file. From georeferencing, we have geographic information embedded into the map, but we still need to create a shapefile for it to be most useful for GIS analysis.
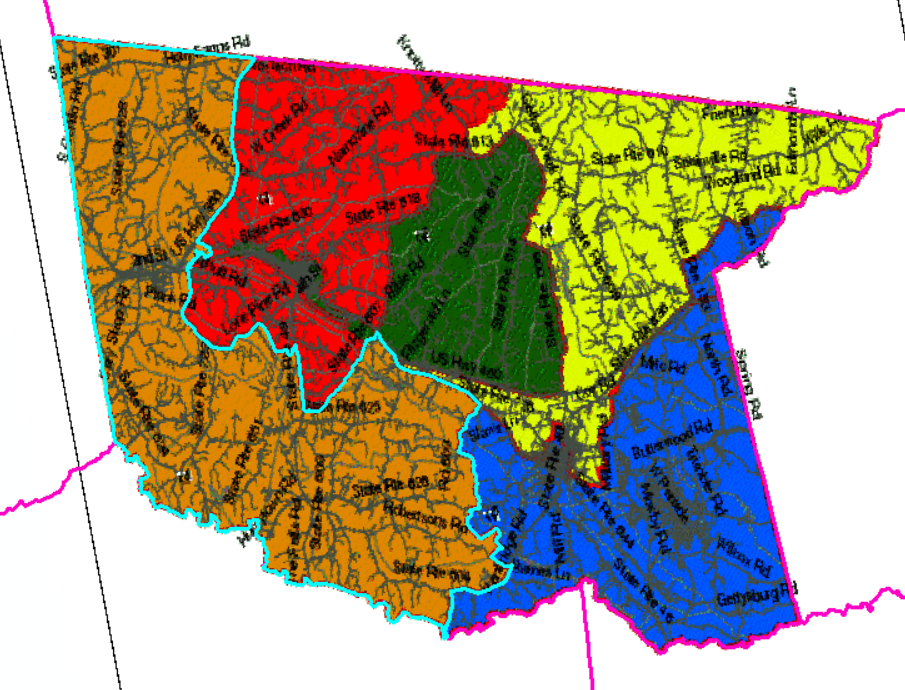
We will use a tool to create features to draw a new shapefile (using a computer mouse or a stylus on a tablet) based on the boundaries in our map image. Other reference shapefiles can come in handy here where there are wobbly features: we can turn on and trace those features (for example, roads or rivers) when we are confident they line up with the boundaries we’re drawing, and directly draw lines between points when we don’t have them on hand. If we’re working from a hand-drawn map, any context clues (intersections, landmarks) can be helpful when we are drawing a digitized version. We can zoom in and out while doing this, and edit and remove vertices if what we have doesn’t seem like the right fit. Below, I’m beginning to trace the boundaries of District 1 (the orange voting precinct) using the county boundary shapefile, starting in the north-western corner and working my way down. The green part of the line is what I’ve already traced, and the gray is showing me the part of the shape I’ve drawn so far.
We want to be sure to save the new shapefile when we are done! It can also be helpful to add information in the Attribute table about the original map it came from, dates, and who digitized and georeferenced it. You can see how there’s error and uncertainty in this process – you want to include any information that would be helpful for your future self or someone else working with the file.
Ta-da! We have created a shapefile for one of these precincts. The shapefile is now ready to be brought into other programs such as R, Python, or used for analysis or presentation with other data in QGIS, ArcGIS, or another mapping platform.
References
-
Caroline County Election Districts & Precinct Boundaries, Caroline County, VA, July 10, 2012.
-
Nottoway County Redistricting Plan – Option 4, Nottoway County, VA, March 4, 2011.
-
GIS (Geographic Information Systems): U.S. & International GIS Data, University of California, Berkeley Library, https://guides.lib.berkeley.edu/gis/international, Apr 5, 2023.