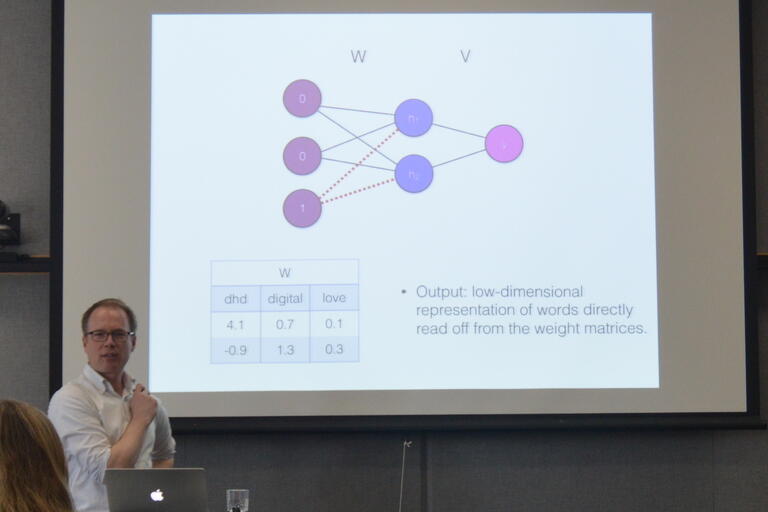
Intelligent research design for data intensive social science
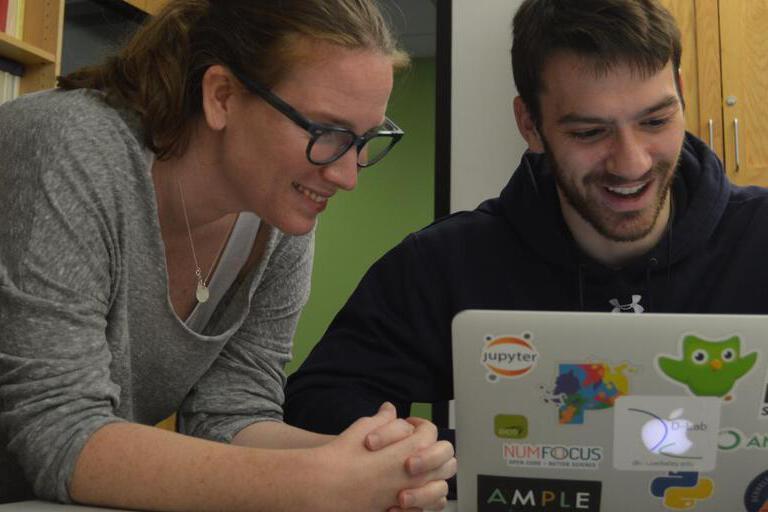
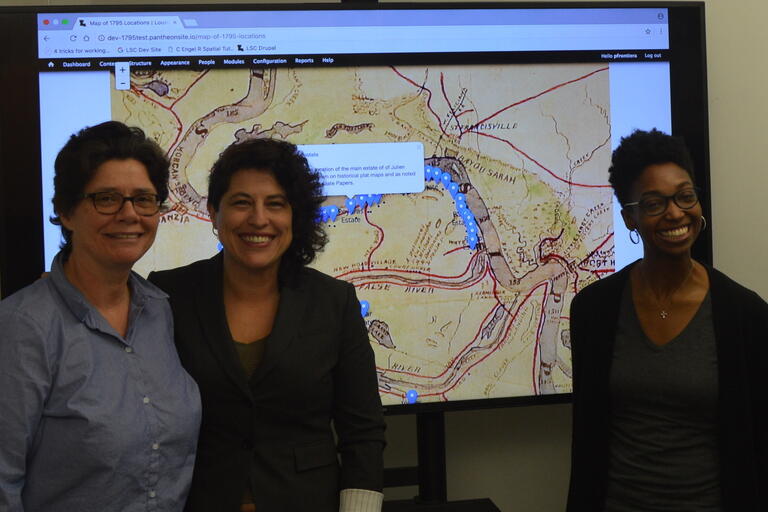
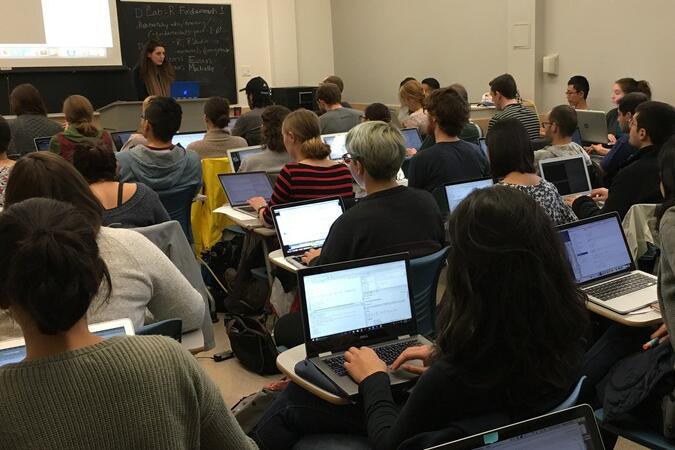
Who we serve D-Lab helps UC Berkeley undergraduate students, graduate students, faculty, and staff move forward with world-class research in data intensive social science and humanities.
What we do D-Lab assists the Berkeley community with the full range of research development, research design and data acquisition. We offer guidance in statistical methods and results to data visualization and communication.
Who we are D-Lab is comprised of scholars who create a learning community that teaches workshops and offers consultations. Join us!
by Leïla Njee Bugha. The proliferation of new sources of data emerging from 20th and 21st century technologies such as social media, internet, and mobile phones offers new opportunities for development economics research. Where such research was limited or impeded by existing data gaps or limited...Read more about Using Big Data for Development Economics
by Lauren Liao. When evaluating causal inference in observational studies, there often is a natural imbalance in the data. Luckily, variables are often measured alongside that can be helpful for adjustment. However, deciding which variables should be prioritized for adjustment is not trivial –...Read more about Design Your Observational Study with the Joint Variable Importance Plot
by Mingfeng Xue. Hierarchical Linear Modeling (HLM) is an extension of linear models, which offers an approach to analyzing data structures with nested levels. This blog elucidates HLM's significance over traditional linear regression models, particularly in handling clustered data and multilevel...Read more about A Basic Introduction to Hierarchical Linear Modeling
by Anna Björklund. Vowels are all around us. Mainstream US English has around twelve unique vowels. How can our brains tell these sounds apart? This blog post will help you answer this question by plotting vowel data from a classic American English dataset by Peterson and Barney (1952).Read more about What Are Vowels Made Of? Graphing a Classic Dataset with R